Splunk AWS Lab via Terraform
No matter what field of study you embark on, there must be a phase in which you learn about learning, or rather, learning about how you learn. Throughout my journey into AWS, i've learned about learning (and still learning)...ideas from Richard Feynman and Tony Buzan to Aristotle, learning is ultimately how efficiently you utilize your mind-scape. Tools and techniques are to be explored, discovered or even created. As I journey through learning Cloud Developent, this blog is a tool to become immersed in the process. Hopefully, you will gain something along the way... "The capacity to learn is a gift. To learn is a skill. The willingness to learn is a choice.” - Brian Herbert
Overview
In this blog post, we'll look at how to set up Splunk monitoring for Windows logs in AWS provisioned by Terraform. Monitoring logs is critical for ensuring your infrastructure's security and health, and Splunk offers extensive logging analysis and visualization tools.
Utilizing Terraform will allow us to quickly provision and destroy infrastructure so that we can gain necessary experience with these tools.
Infrastructure
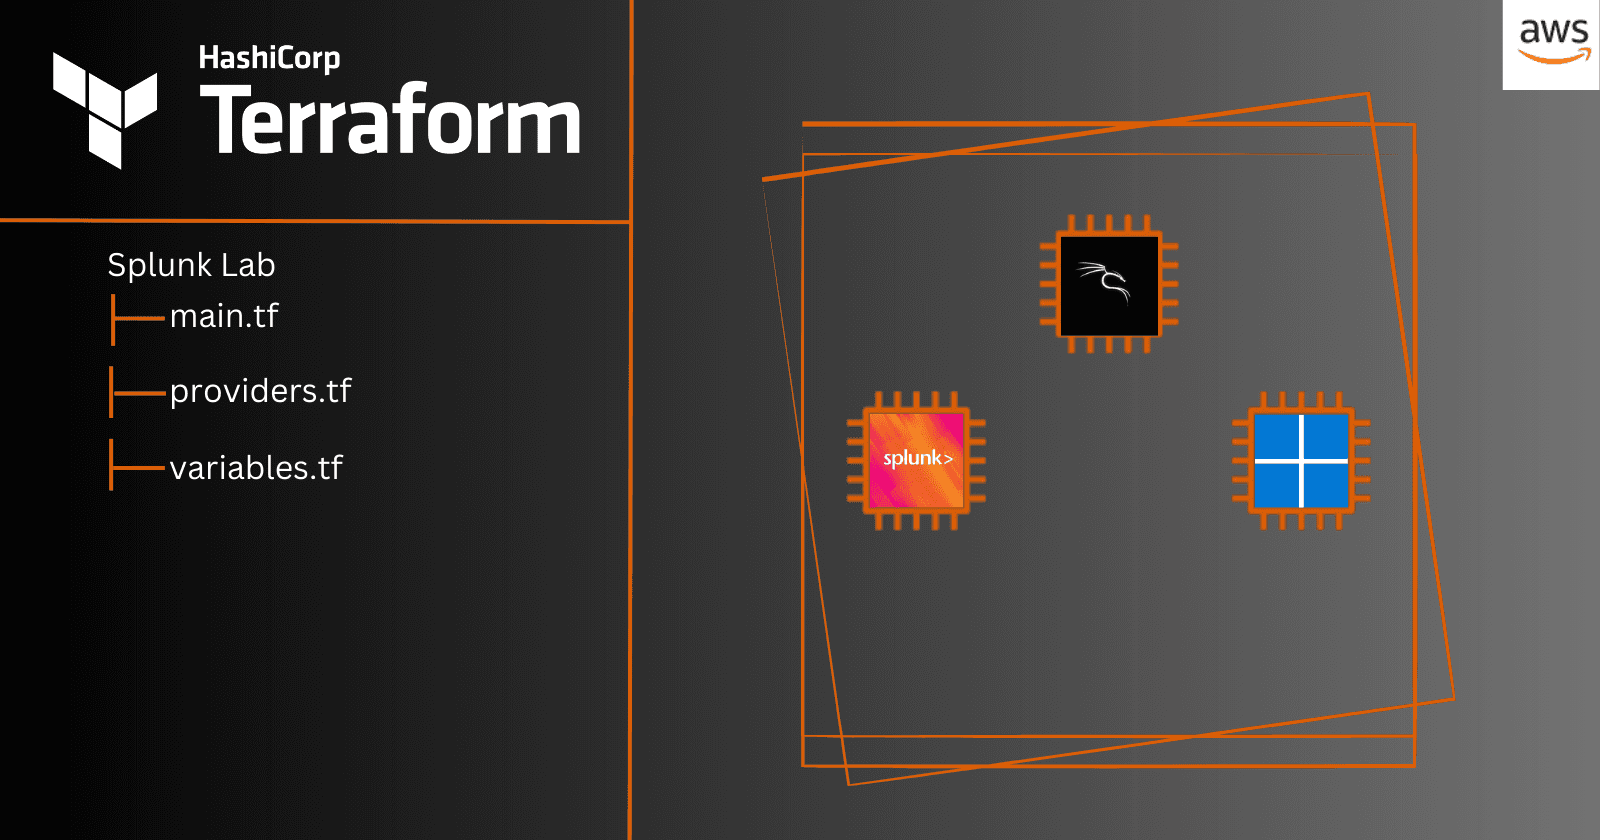
Our setup includes deploying three EC2 instances within a VPC in us-east-1: a Kali Linux box for penetration testing, a Splunk instance running on Ubuntu Desktop for log monitoring, and a Windows Server 2022 instance that will be monitored.
Please note that some of the ami's utilized may require a subscription.

Provisioning
We'll begin by creating our infrastructure in AWS using Terraform. Terraform allows us to specify our infrastructure in code, making it simple to manage and replicate our configuration. We'll be provisioning 3 EC2 instances in a single subnet.

Since I have gone over Terraform in a previous post, I will be skipping how to get started with Terraform. Please visit my previous blog post for more information:
Terraform template can be found on my GitHub repo
Download & Configure Splunk Enterprise
Step 1: Login with Instance ID outputted in Terraform
- Use Instance IP then you will be prompted with Netspectrum/Ubuntu for InstanceID
Step 2: Change VNC Password
- On Desktop
Step 3: Download Google Chrome if having issues with Mozilla and Splunk
wget https://dl.google.com/linux/direct/google-chrome-stable_current_amd64.deb
- Install & Check Default Browser
sudo dpkg -i google-chrome-stable_current_amd64.deb
google-chrome
Step 4: Download Splunk Enterprise from website

Step 5: Install
- Cd into downloads folder
cd ~/Downloads
sudo dpkg -i splunk.<tab to auto complete>

Step 6: CD into /opt/splunk/bin and start service
cd /opt/splunk/bin
sudo ./splunk start

- Page Down and accept EULA - Enter a Username / Password

Step 7: Logging into Splunk Instance
- Paste the web server into instance browser

- Login with credentials you created in the previous step

Step 8: Create Index
- Settings > Index
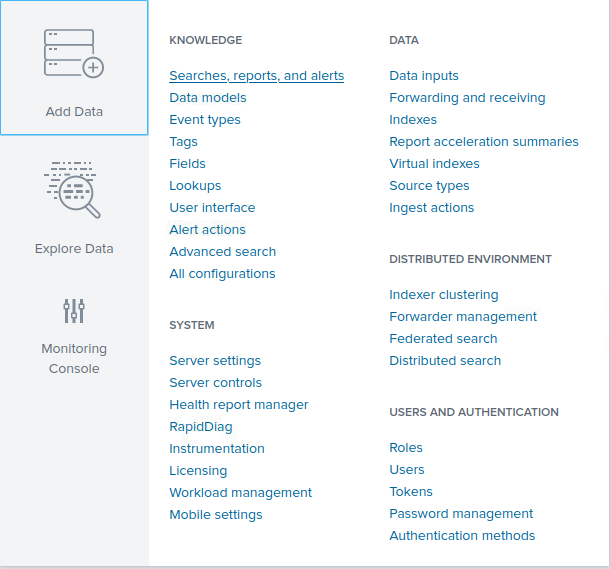
- Click New Index, my index name will be Windows-Security and i'll keep all defaults

Step 9: Setup Forwarding and Receiving > receiving port to listen on 9997


Download & Configure Splunk Universal Forwarder
Step 1: RDP into Windows box
Step 2: Download Splunk Universal Forwarder

- CD into downloads folder

Step 3: Install & Configure
- Click Customize options > Next > Next > Next


- We will be monitoring Application, Security and System logs

- Create Credentials > Next

- Setup Receiving Indexer to Private IP of Splunk Instance and default port 9997

- Private IP for the Splunk Instance can be obtained either through the AWS console or utilizing the following command and viewing inet address
ip a

Finish

Step 4: Configure Inputs.conf
- CD into
C:\Program Files\SplunkUniversalForwarder\etc\system\local

Copy and Paste outputs.conf > Rename copied file to inputs.conf
Append the following to the file and save
[WinEventLog://Security]
index = windows-security (or name of your created index)

disabled = 0

Step 5: Restart Universal Forwarder via CLI
cd C:\Program Files\SplunkUniversalForwarder\bin
splunk.exe restart

Reviewing Logs in Splunk
Step 1: Head back to Splunk Instance
- Search our newly created index to review logs

- Looks like we have a few logs to review

- Lets generate additional logs by adding & deleting users, this should create system logs. On the Windows Instance I added and deleted a user Splunk_Test:


- Back on our Splunk instance we can see the newly created logs:


Terraform Destroy
To ensure we do not incur any additional costs, we will perform:
Terraform destroy

By following these steps, you will be able to configure monitoring for Windows logs in AWS using Splunk and Terraform.
Monitoring user activity and system changes is critical for ensuring the security and integrity of your infrastructure, and Splunk gives you the tools you need to successfully analyze and respond to log data.
With this arrangement, you will be able to quickly provision and destroy infrastructure so that you can gain practice with these tools.
In future installments, we will perform PenTests on our monitored instances, PCAP analysis and network monitoring.
Till next time!


